Case study · Environmental data science

Emissions that conventional analysis missed

How to link heterogeneous industrial data to explain diffuse emissions of a gas on a biogas valorization site — and why timing was key.

PythonTime series Spatial analysisModeling Reproducible notebooks
~320,000consolidated measurements
5 minsensor time step
~12 hdetected effect delay
210geolocated points

01The context

An industrial biogas valorization site sought to understand why a gas was being emitted diffusely into the ambient air—an issue both environmental and operational. The difficulty was not a lack of data, but their nature: several independent sources, at different time steps (from 5 to 10 minutes), covering several months, and distributed across two distinct subsystems—the capture network and the treatment platform.

The first task was to turn this disparate set into a usable database: nearly 320,000 sensor measurements and over 87,000 supervision records, to be aligned and checked.

02The approach

03The turning point: time as a hidden variable

When considered simultaneously, the data showed almost nothing: correlations near zero, an apparent lack of link between the facility's operation and emissions. A hasty diagnosis would have concluded “no relation”.

By testing correlations lagged in time, a clear signal emerged: a factor measured about 12 hours earlier reached a correlation of around −0.3 with the emissions of the moment, against virtually zero simultaneously. The system was reacting with a delay — something an instantaneous analysis could not see.
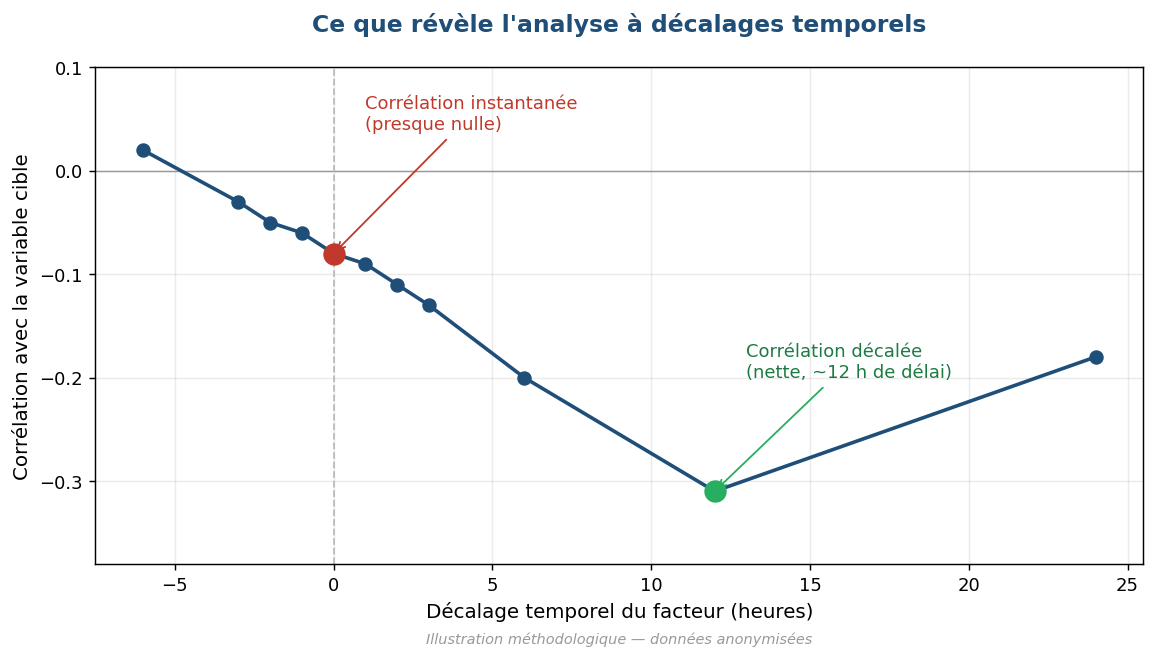
Correlation curve by time lag: zero at instant t, pronounced (about −0.3) around a 12-hour delay

Methodological illustration (anonymized data): the correlation, virtually zero simultaneously, becomes clear (≈ −0.3) with a delay of about 12 hours.

The lesson: a weak instantaneous correlation does not mean “no relation”. In any system where effects take time to propagate, time lag is part of the analysis.
04A convergence that strengthens the diagnosis

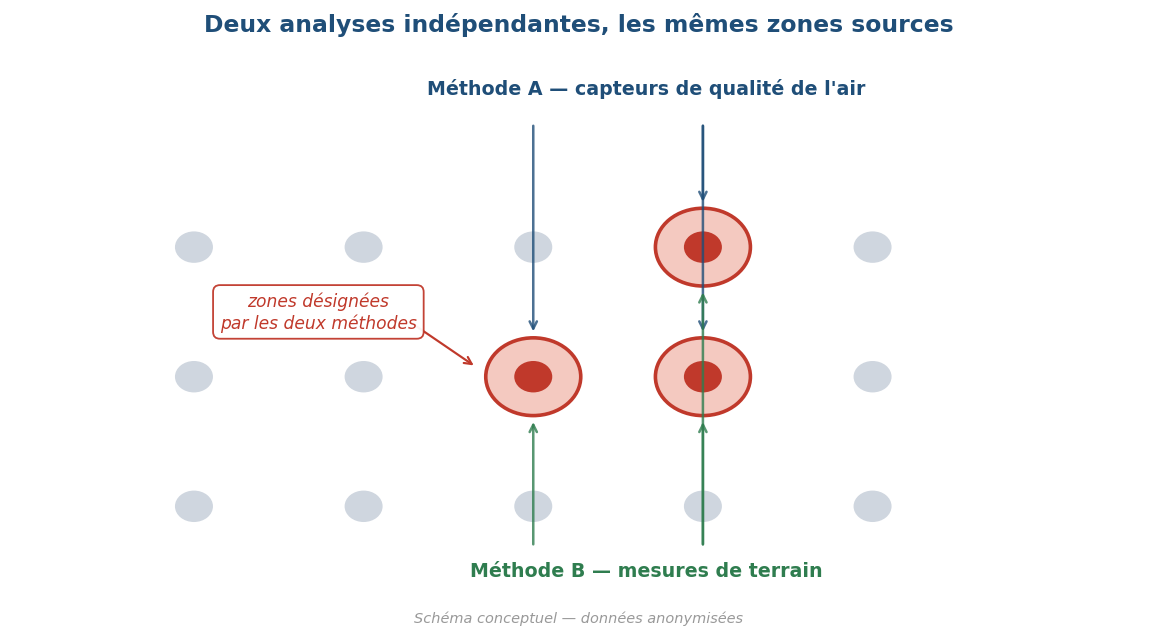
Two analyses conducted on totally independent sources — air quality sensors on one side, field measurements on the other — designated the same sectors of the site as the most loaded. When two methods that share no data arrive at the same result, confidence in the diagnosis increases markedly.

Conceptual diagram: two independent methods pointing to the same areas of a site

Conceptual diagram (anonymized data): two independent methods designate the same source areas.

05Results

A delayed mechanism

Emissions respond to the facility's conditions with a delay of about 12 hours — a physically coherent reading, and a result that conventional analysis was masking.

Convergent source areas

Two independent analyses designate the same sectors of the site, strengthening the reliability of the diagnosis.

An acknowledged conclusion on the limits

The tested predictive model did not reach a usable reliability level. Rather than overselling it, the study explains it — and points to the data that would make it possible.

06What this project illustrates

Beyond the field, this mission summarizes a way of working: starting from imperfect data, drawing solid explanations, and remaining rigorous even in admitting limitations. A good model is not one that promises everything, but one whose scope is known exactly.