Results of the Clinical Trial
Initial comparison between groups (D0)
| Variable | Experimental Group (M ± SD) | Control Group (M ± SD) | p-value (Welch) |
|---|---|---|---|
| Age | 23.68 ± 2.08 | 23.32 ± 2.34 | 0.5886 |
| Weight | 72.41 ± 10.44 | 70.45 ± 11.21 | 0.5527 |
Between-group comparisons by day
Var-Alg
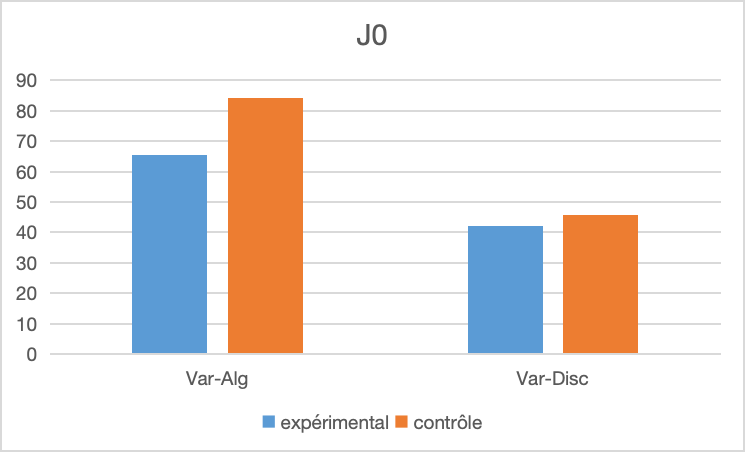
Day 0
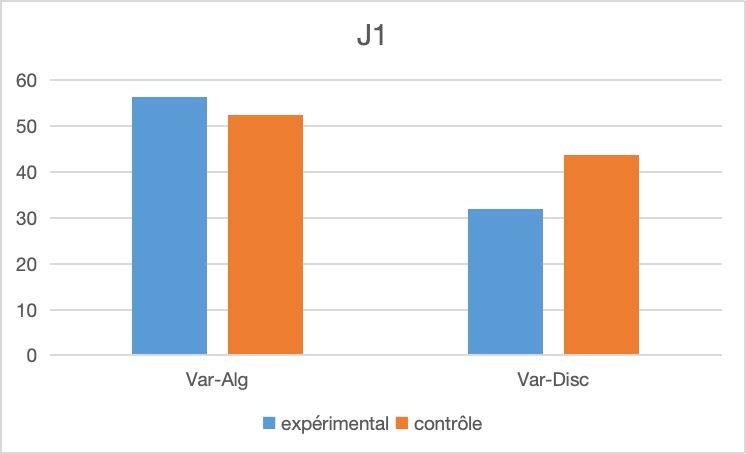
Day 1
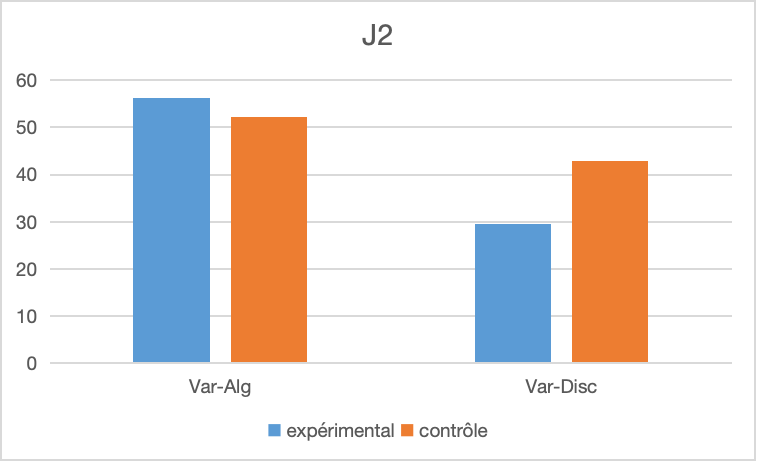
Day 2
| Day | Experimental (M ± SD, N) | Control (M ± SD, N) | p-value (Welch) |
|---|---|---|---|
| J0 | 64.28 ± 18.64 (N=22) | 85.65 ± 33.49 (N=22) | 0.0133 |
| J1 | 56.64 ± 18.88 (N=22) | 82.09 ± 29.61 (N=22) | 0.0002 |
| J2 | 60.00 ± 19.01 (N=22) | 84.77 ± 31.32 (N=22) | 0.0039 |
Var-Disc
| Day | Experimental (M ± SD, N) | Control (M ± SD, N) | p-value (Welch) |
|---|---|---|---|
| J0 | 34.06 ± 6.12 (N=22) | 36.02 ± 6.99 (N=22) | 0.2817 |
| J1 | 39.45 ± 5.66 (N=22) | 42.77 ± 7.25 (N=22) | 0.0323 |
| J2 | 41.59 ± 6.63 (N=22) | 43.95 ± 6.91 (N=22) | 0.1569 |
Within-group comparisons (RM-ANOVA and post hoc)
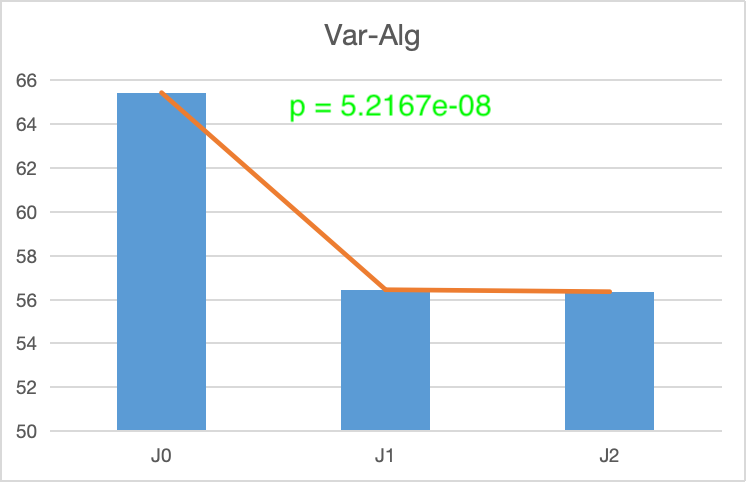
Var-Alg
Experimental — RM-ANOVA p = 5.2167e-08
| Comparison | Avg. Difference | p-value (Student) |
|---|---|---|
| D0 vs D1 | 7.613 | 9.8221e-07 |
| D1 vs D2 | -3.000 | 0.0046 |
| D0 vs D2 | 4.613 | 2.7262e-16 |
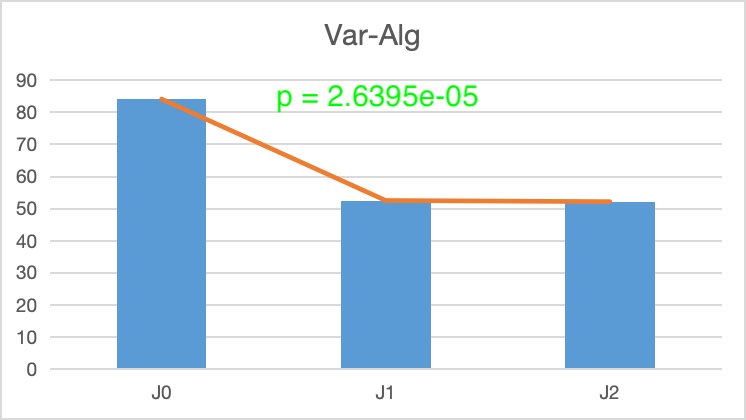
Control — RM-ANOVA p = 2.6395e-05
| Comparison | Avg. Difference | p-value (Student) |
|---|---|---|
| D0 vs D1 | 3.455 | 1.1738e-14 |
| D1 vs D2 | 0.636 | 0.00018 |
| D0 vs D2 | 4.091 | 2.6060e-17 |
Var-Disc
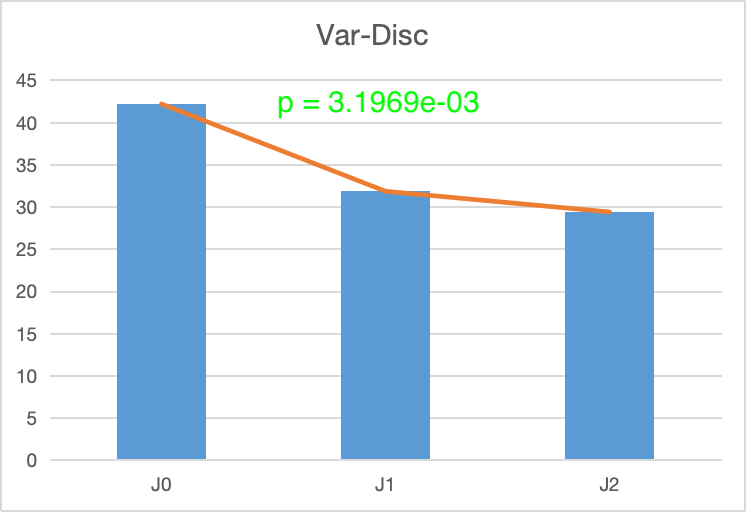
Experimental — RM-ANOVA p = 3.1969e-03
| Comparison | Avg. Difference | p-value (Student) |
|---|---|---|
| D0 vs D1 | -5.386 | 9.7827e-06 |
| D1 vs D2 | -0.500 | 0.0046 |
| D0 vs D2 | -5.886 | 2.7262e-16 |
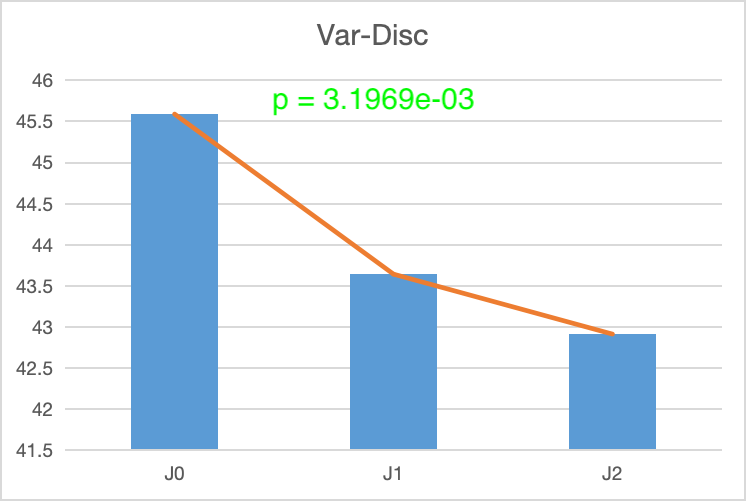
Control — RM-ANOVA p = 9.6440e-03
| Comparison | Avg. Difference | p-value (Student) |
|---|---|---|
| D0 vs D1 | -3.455 | 1.1738e-14 |
| D1 vs D2 | -0.636 | 0.00018 |
| D0 vs D2 | -4.091 | 2.60599e-17 |
Interpretation Model
The analyses show the absence of a statistically significant difference between groups for sociodemographic variables (age and weight), with p-values above the 5% threshold, confirming their initial homogeneity.
The analyses reveal significant differences between the groups at D0, D1, and D2 (p<0.05) for var-Alg. Given the significant difference observed initially (at D0), the most appropriate approach is to compare the intergroup variation between D0 and D2.
The results of the repeated-measures ANOVA for the two variables var_Alg and var-Disc show significant changes between D0 and D2 within both groups.